The last few months, I have been really thinking about the idea of how kids can do the "work" of real scientists in my class while at the same time learning about what it is that scientists actually do. We have been really focused on the types of thinking that scientists do and how scientists use evidence to make scientific claims.
One of the ways that I (thanks to my school's amazingly forward thinking/knowledgeable Technology Integration Teacher) have done this is through the use of Google Apps, specifically Google Spreadsheets. This has allowed every student in my three sections of seventh grade science to share data with each other.
In order to do something like this before Google Apps, I would have to do one of two things: A) Have students read out their data in class while the rest of us record it together or B) Have students turn in their data tables to me and then I compile after class and make a copy for everyone. Both options are time and paper consuming. Also, with both options, if I wanted to have students create computer-generated results, they would have to type all of the data into Excel- so usually I would just have them hand-draw graphs. Hand-drawing graphs, like hand-drawing maps, is an important skill conceptually, but often is time-consuming, not very precise, and do not reflect the real world of 2013. This is not to say that I would never have students hand-draw a graph. However, once they get the big idea of how graphs are constructed, it is more important to shift the focus to the use of graphs as a scientific tool and not the construction of the graph itself.
The Process...
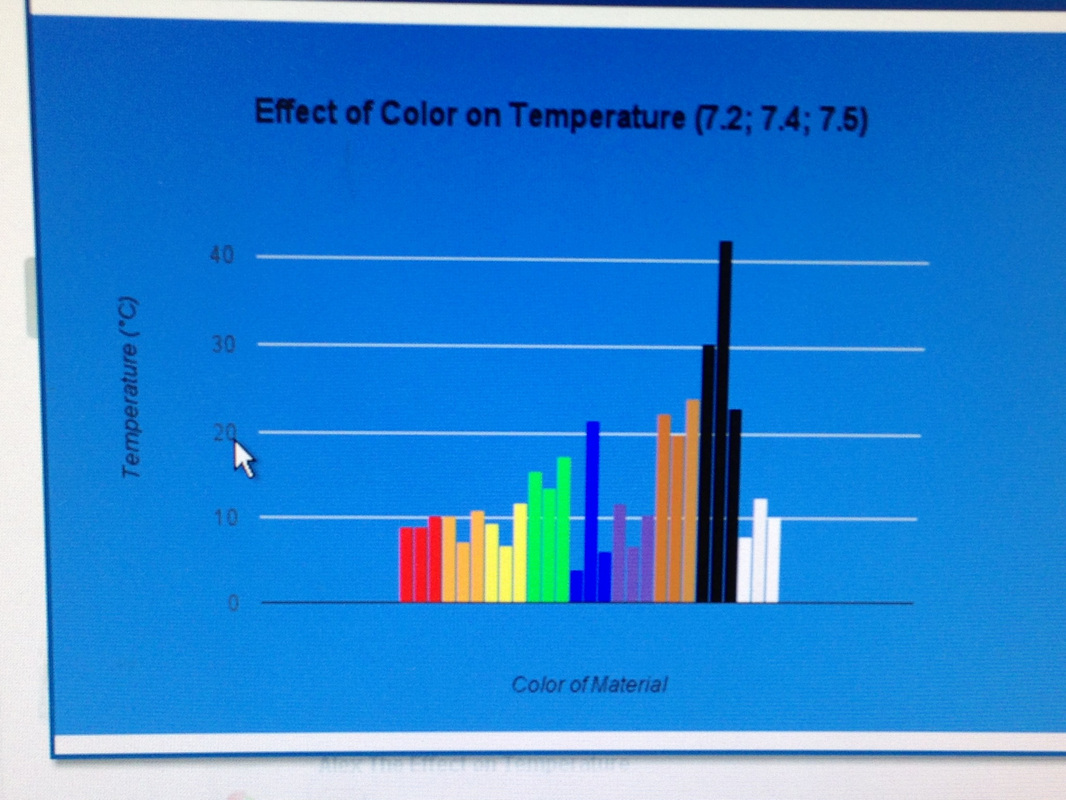
Students were testing the question, "Which color best transforms electromagnetic energy into thermal energy?" in other words..."Which color gets warmest under a heat lamp?" because we are trying to figure out some ways that humans control energy in order to live in cold places. The purpose of this experiment is two-fold. Firstly, students will ultimately be designing an article of clothing for cold weather survival and need to know which color to make their clothing- and need some actual scientific data to use as supporting evidence. And, secondly, we are in the process of learning how to do experiments that generate "believable" data.
We tested 9 different colors and students were in small groups to set up their experiment. So, in my three classes of science classes, we had 27 data sets that we wanted to analyze. Doing things "the old way" would have been a logistical nightmare!
We tested 9 different colors and students were in small groups to set up their experiment. So, in my three classes of science classes, we had 27 data sets that we wanted to analyze. Doing things "the old way" would have been a logistical nightmare!
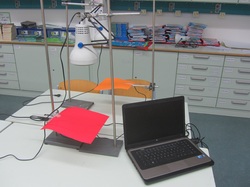
Students use Logger Pro data loggers- basically a digital thermometer that connects to a computer- in order to collect their data. Logger Pro allows you to choose length of time and frequency of data collection and students decided that 20 minutes would be a sufficient amount of time.
It took awhile to set up everyone's experiments exactly the same way so that we could make sure we were controlling certain variables. But, certain kids had jobs like measuring the distance between the paper and the lamp on everyone's experiment.
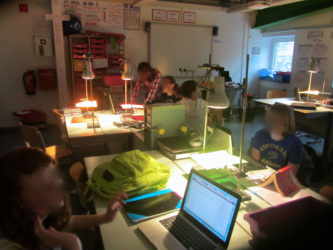
Once everything was set up, as you can see from the picture where the lights are all off, we began our data collection. We also cooked ourselves in the meantime because the room got really hot with the heat lamps all turned on!
It took awhile to set up everyone's experiments exactly the same way so that we could make sure we were controlling certain variables. But, certain kids had jobs like measuring the distance between the paper and the lamp on everyone's experiment.
Once everything was set up, as you can see from the picture where the lights are all off, we began our data collection. We also cooked ourselves in the meantime because the room got really hot with the heat lamps all turned on!
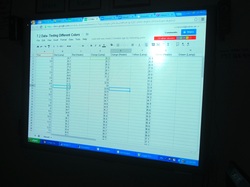
Once our data was collected for each group, students exported their data from Logger Pro and imported it into Google Spreadsheets. I had pre-created a Google Spreadsheet that I "shared" with them and then each group uploaded their data to our class spreadsheet.
Each student then made a digital copy of the data for him/herself and create a graph of just their own class data. We were able to draw some information from these singular class graphs, but realized that having only one test does not really allow you to see any patterns, and is not necessarily reliable in terms of a solid conclusion.
After we'd completed the data collection with all of my classes, I shared the spreadsheets from all of the classes with all of my students. They then compiled the data themselves onto another spreadsheet and then created graphs showing the data from all three classes- 27 groups of students!
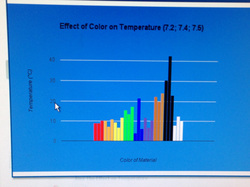
So, our final products were graphs that reflected the data of three sections of seventh grade science. Looking at this much data, in this way, allows us to make some conclusions about color, but also allows us to see that there were some anomalous results that must be addressed (look at blue, for example!). Doing something like this, with this much data, would have taken many hours of class work and homework and would have been an extremely laborious activity. Instead, because of Google Docs, we completed the entire process (doing experiment, sharing, graphing) in only three 50-minute class periods.
As my students become even more proficient at computer generated graphs and using Google Docs, the time will decrease even further. This frees up the time for us to actually discuss the data and to see if we need to collect more data because further questions have been raised, or if we can sufficiently support/reject our hypotheses. This is the part of science that is so important for kids- thinking like a scientist instead of just doing the busy work of a scientist.
For any science teachers out there who are saying to themselves, "yeah, but I don't have fancy, private school electronic data loggers" (a totally valid point) you can consider that students could still type their data from a regular thermometer, ruler, whatever, into Google Spreadsheets and share it with each other.
This has really changed how I think about collaboration in a scientific environment and how technology really should be the means and not the end of the learning.
Go forth and Google Doc "share!"
 RSS Feed